
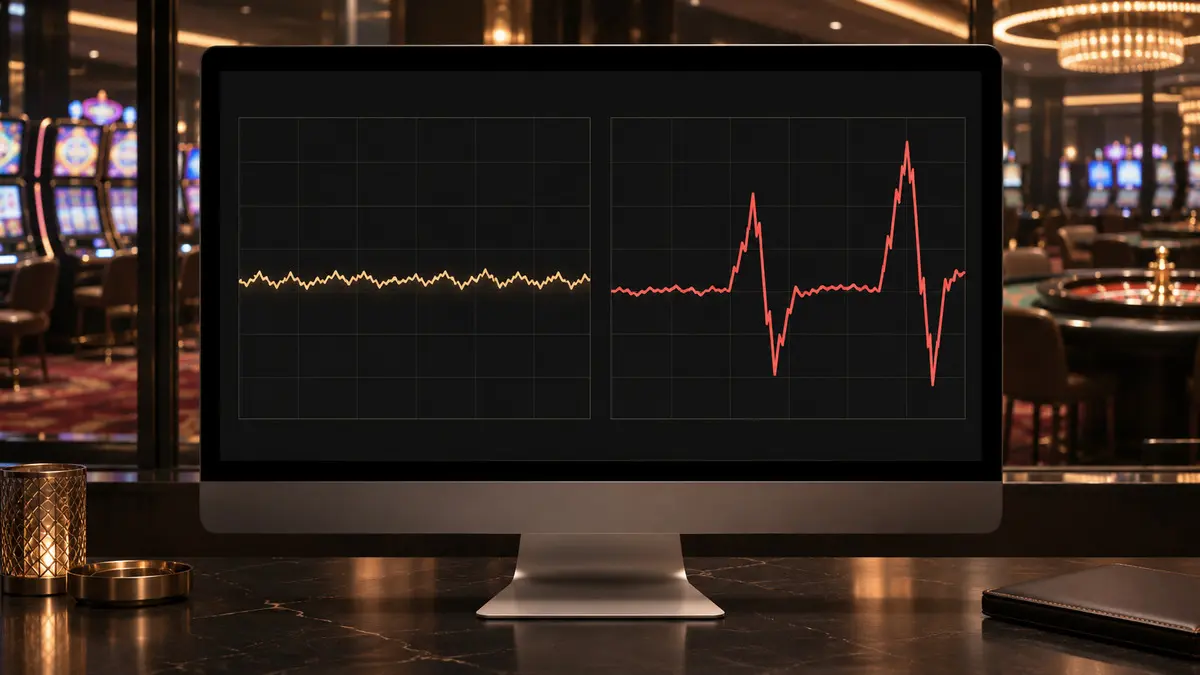
Two slot games can have the same theoretical hold and still produce completely different visits. One may recycle a bankroll through frequent modest awards. Another may deliver long losing stretches interrupted by a rare, substantial win. Slot machine volatility helps explain the difference, but it is not the only part of the pay table that shapes the experience.
For casino management, volatility affects short-term GGR dispersion, time on device, bankroll survival, jackpot exposure, player preference, promotional experience and the amount of play required before a performance conclusion becomes credible.
The operational question is not whether high or low volatility is better. It is whether the payout profile fits the player mission, bet range, floor position and commercial role assigned to the game.
The examples in this article are illustrative. Volatility, hit frequency, prize distribution, theoretical RTP and confidence limits must be taken from the approved manufacturer mathematics and the method accepted by the relevant regulator. A label such as “high volatility” is not a substitute for the mathematical report.
What Slot Machine Volatility Actually Measures
Volatility describes the dispersion of possible results around a game’s expected average. In practical terms, a lower-volatility pay table usually concentrates more return in frequent smaller awards. A higher-volatility pay table usually allocates more return to less frequent, larger awards.
The mathematical concept is commonly expressed through variance or standard deviation:
Variance = Σ[Probability of outcome × (Outcome − Expected outcome)²]
Standard deviation = √Variance
A larger standard deviation indicates a wider spread of possible results. It does not tell management exactly when prizes will occur, how the player will perceive the session or how quickly a specific bankroll will be exhausted.
Volatility Is Not RTP or Hit Frequency
Three terms are often mixed together:
| Measure | What It Describes | What It Does Not Explain |
|---|---|---|
| Theoretical RTP or hold | Expected long-run share of wagers returned to players or retained by the casino | The sequence and size distribution of session-level results |
| Hit frequency | How often a play produces an award under the game’s defined rules | Whether the award exceeds the wager or how large it is |
| Volatility | How widely outcomes may disperse around the expected average | The exact session path or customer response |
| Prize allocation | Where the pay table places its return across small, medium, feature and jackpot awards | A complete prediction of time on device for every player |
A game with a high hit frequency can still feel harsh if many recorded wins return less than the stake. Two games with identical RTP can create very different bankroll paths. Managers should therefore avoid using RTP, hit frequency or volatility as interchangeable labels.
Gaming Laboratories International describes RTP as the expected long-run percentage returned to the player and evaluates volatility separately within game-mathematics analysis. That separation is essential for operational reporting.
Equal Hold Does Not Mean Equal Sessions
Assume two games both have an 8% theoretical hold. A player begins with 100 units and wagers one unit per spin.
- Game A places more return into frequent small and medium awards.
- Game B places more return into infrequent large awards.
The expected loss calculation is the same for both games:
Theoretical loss = Coin-in × Theoretical hold
If each game records 1,000 units of coin-in, the theoretical loss is 80 units. That expectation does not describe the path. Game A may keep more individual sessions alive through repeated recycling. Game B may produce more early bankruptcies alongside a smaller number of large winners.
Research published by the UNLV Gaming Research & Review Journal found that changing pay-table standard deviation while holding par constant affected the number of plays achieved by losing simulated players. More recent 2026 research went further: games with the same par and total variance could still produce different time-on-device results when the pay table allocated that variance differently.
This means the familiar low-, medium- and high-volatility label is only a first filter. For important purchases or conversions, operators should request more detail about prize distribution, feature contribution and expected session behavior.
How Volatility Changes Short-Term Casino Revenue
High-volatility games normally produce a wider range of realized results over short periods. A jackpot or concentrated series of major awards can push daily GGR far below theoretical win. A period without those awards can push actual hold above expectation.
Theoretical win = Coin-in × Volume-weighted theoretical hold
Actual-to-theoretical index = Actual GGR ÷ Theoretical win × 100
An index of 65% or 145% is not automatically evidence of a faulty or exceptional game. The interpretation depends on games played, bet distribution, jackpot outcomes, configuration accuracy and the approved mathematical variance.
This relationship is explained in more detail in the guide to theoretical hold versus actual hold. The main management rule is straightforward: use daily actual win for reconciliation, but do not use one short actual-win period as the sole basis for a product decision.
Volatility Changes the Required Observation Window
A high-volatility game generally needs more play before actual results provide a stable view of its expected economics. “One month” is not a statistical sample definition. A month with two million games is not equivalent to a month with twenty thousand.
The correct evaluation should begin with the manufacturer’s approved variance and the number of games played. If the mathematical report provides the required values, management can calculate or request a confidence interval for the observed result.
Standard error of average game result = Game standard deviation ÷ √Games played
As the number of games increases, the standard error narrows. The rate of convergence depends on the underlying mathematics. A progressive product with rare top awards may remain highly dispersed after a period that appears long on the calendar.
Management error: Extending the test only when a game underperforms, but ending it immediately after an unusually profitable week.
How Slot Machine Volatility Affects Player Experience
Volatility can influence the rhythm of a visit, but observed behavior must be measured rather than assumed. Relevant indicators include:
- Games played per session
- Session duration and number of sessions per visit
- Bankroll additions and cash-out behavior
- Average bet and bet changes during the session
- Return rate to the same title or game family
- Switching between volatility profiles
- Play before and after a feature or significant award
A player should not be permanently labelled “high volatility” because of one visit. Preferences can change with bankroll, occasion, trip purpose, accompanying group and prior outcomes.
Responsible-gaming indicators must remain separate from commercial opportunity. Chasing losses, repeated bankroll replenishment or unusually extended play should trigger the property’s approved protection processes, not more aggressive targeting.
Build the Floor Mix From Demand, Not Unit Counts
A balanced floor is not created by assigning an arbitrary percentage of machines to low, medium and high volatility. Unit share is only supply. Management must compare it with demand, use, value and concentration.
| Volatility Group | Machine Share | Coin-in Share | Peak Utilization | Theoretical Net Contribution Index |
|---|---|---|---|---|
| Lower | 25% | 18% | 44% | 82 |
| Medium | 45% | 49% | 71% | 116 |
| Higher | 30% | 33% | 63% | 103 |
In this illustrative example, the medium-volatility group attracts more coin-in than its share of units and reaches the highest peak utilization. That may indicate a capacity constraint. The lower-volatility group looks weaker, but automatic removal could damage daytime play, low-denomination coverage or a loyal repeat segment.
The analysis should sit within a broader slot analytics and floor-optimization framework. Compare volatility groups by machine-day, available hour, theoretical value, net contribution, player concentration, session behavior and persistence across periods.
Use the Right Peer Group
A new high-volatility linked progressive should not be compared with the overall floor average. Its peer group should be reasonably similar in:
- Volatility and prize architecture
- Denomination and active bet range
- Progressive or non-progressive structure
- Cabinet type and game format
- Location, traffic and visibility
- Operating hours and technical availability
- Ownership, lease or participation economics
Use the property’s established slot machine performance metrics to separate demand from short-term luck. Coin-in and games played measure customer choice. Weighted theoretical win estimates expected value. Actual GGR reconciles the period. Net contribution incorporates the direct commercial cost.
Test Volatility With a Controlled Framework
- State the decision. Define whether the test will support expansion, conversion, relocation, renegotiation or removal.
- Verify the mathematics. Record RTP, volatility, hit-frequency definition, feature contribution, jackpot structure and active bet range.
- Select comparable units. Control for cabinet, location, denomination, operating schedule and commercial model.
- Set the observation rule in advance. Use games played and approved variance, not calendar time alone.
- Measure the surrounding zone. Identify play transferred from nearby machines instead of assuming all volume is incremental.
- Review player concentration. Separate broad demand from the effect of a few high-value customers.
- Calculate net contribution. Deduct participation, jackpot, free-play and direct technical costs consistently.
Net machine contribution = Adjusted gaming value − Participation cost − Jackpot cost − Promotional cost − Direct operating cost
This controlled approach connects volatility decisions to practical slot operations management rather than allowing one large payout to determine the fate of a product.
Volatility and Promotional Design
Free play of the same face value can create different customer experiences across different pay tables. A higher-volatility title may create a small number of memorable winners but many short redemptions. A lower-volatility product may extend play and generate more visible award events without changing the nominal offer value.
Promotion evaluation should therefore measure delivered free play, games played, session extension, subsequent cash wagering, repeat visits and net incremental contribution. These measures belong inside the wider casino marketing strategy; volatility should inform the experience, not be used to imply guaranteed excitement or return.
Operational Warning Signs
| Warning Sign | Possible Explanation | Required Check |
|---|---|---|
| Extreme month-to-month hold movement | Normal variance, jackpot outcome or data problem | Games played, approved variance, meters and jackpot accounting |
| Strong GGR with weak coin-in | Favourable short-term realization | Theoretical win and actual-to-theoretical index |
| High coin-in from very few players | Concentration rather than broad demand | Unique players, session share and repeat behavior |
| Short sessions after promotional redemption | Prize allocation or bet-range mismatch | Games played, cash wagering and comparison with matched offers |
| Repeated player complaints | Expectation, communication or product-fit problem | Game information, staff explanations and complaint patterns |
Make Volatility Part of the Product Decision
Slot machine volatility affects far more than the size of the top prize. It influences bankroll paths, time on device, short-term revenue dispersion, testing requirements, promotional experience and the amount of liquidity needed for large awards.
The next action is to add volatility and prize-allocation fields to the floor master data, then rebuild peer groups using those characteristics alongside denomination, location and commercial model. Any product without reliable mathematical descriptors should remain outside automated keep, convert or replace decisions until the supplier provides the required evidence.
Source note: The mathematical distinctions in this article were checked against Gaming Laboratories International’s game-mathematics guidance and research published by the UNLV Gaming Research & Review Journal on pay-table standard deviation and plays per losing player and variance allocation and time on device.